The market is conveying conflicting signals.
Bitcoin is inching closer to the $70,000 milestone, signaling a potential breakthrough for digital gold. Currently trading around $69,311, Bitcoin’s price trajectory has been characterized by fluctuations without a discernible pattern. Nevertheless, its proximity to the $70,000 threshold holds significant implications. This crucial level may determine whether Bitcoin embarks on a trajectory toward another all-time high (ATH) or continues its consolidation phase. Surpassing this level could propel Bitcoin to even greater heights, marking a significant development for the cryptocurrency market.
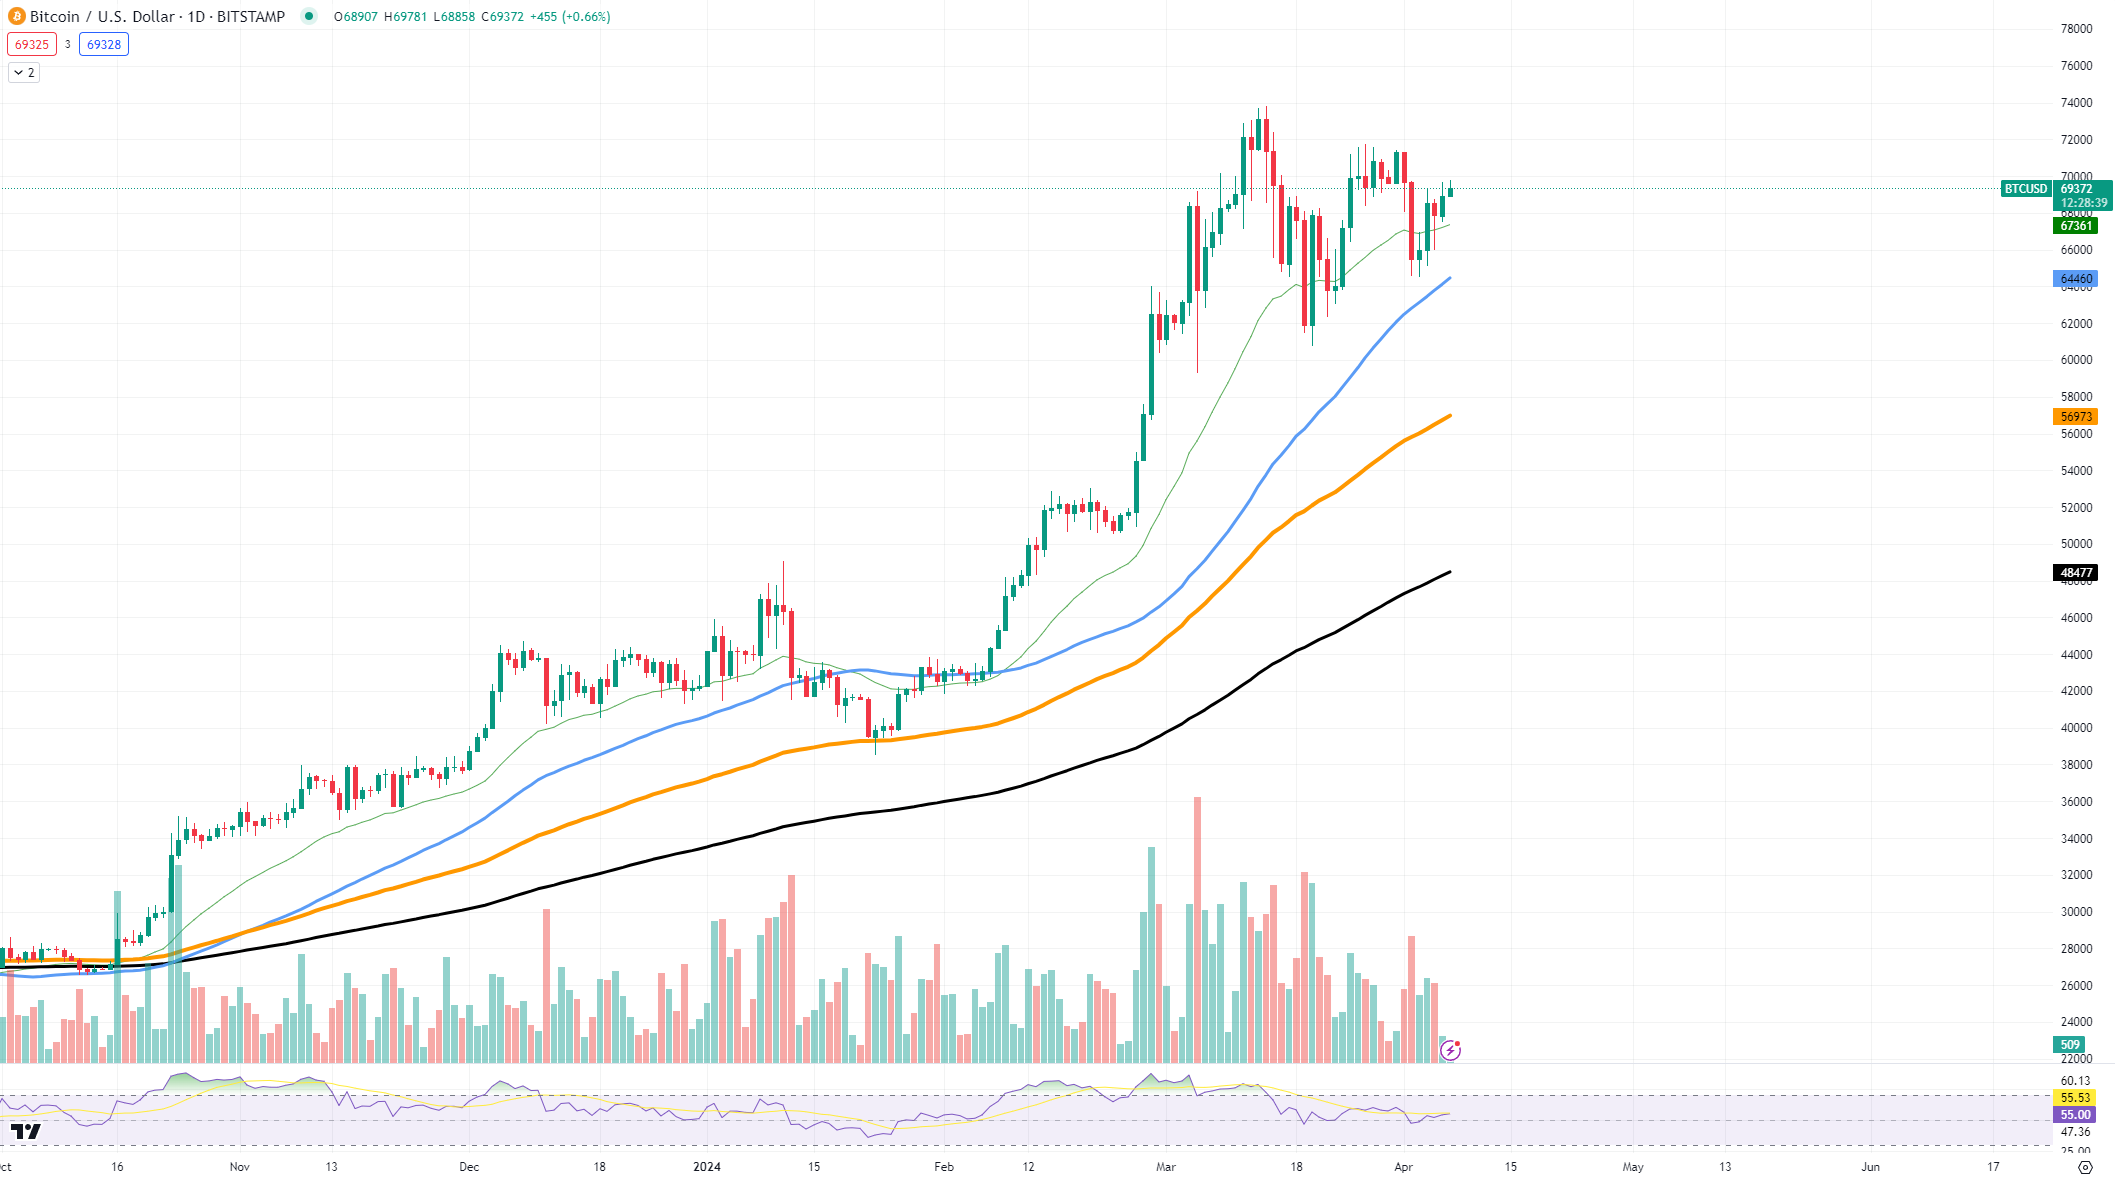
However, the current market conditions present a conundrum with conflicting signals, casting uncertainty on Bitcoin’s imminent surge past the $70,000 threshold. While there’s a possibility of Bitcoin testing this crucial level, it remains unclear whether it can sustain its position above it. Maintaining a trajectory of growth necessitates Bitcoin’s ability to remain above the 50-day Exponential Moving Average (EMA), a challenging feat given the ambiguous market dynamics at present.
If Bitcoin manages to uphold its position above these crucial support levels and successfully breaches the $70,000 mark, it could herald the onset of another substantial price uptick.
Positive Developments for XRP
Following a challenging period, XRP receives a glimmer of positivity as it surpasses its 100-day Exponential Moving Average (EMA). Presently valued at $0.5967, this upward movement holds significance as breaching the 100 EMA threshold suggests a potential upward trajectory for XRP’s price. Sustaining this momentum and remaining above the 100 EMA sets the stage for the next significant hurdle: the 50-day EMA, positioned around $0.62. A successful breakthrough here could signify XRP’s readiness to ascend towards its yearly peak once more.
However, despite this positive shift, there remains uncertainty regarding XRP’s sustained upward trajectory. It’s plausible that the price may not experience further significant increases, casting doubt on the notion of a genuine resurgence. To ascertain XRP’s resurgence, it’s imperative to observe whether it maintains its position above the 100-day EMA and subsequently surpasses other key resistance levels, such as the 50-day EMA. Investors and cryptocurrency observers will closely monitor XRP’s performance. A successful breach of additional resistance levels could indicate a genuine comeback for XRP. Conversely, a failure to do so, resulting in the price dropping below the 100-day EMA once more, may imply that XRP’s path to recovery is still in progress.
Ethereum’s stability is confirmed
Within the Ethereum ecosystem, a critical threshold has been reached.
The cryptocurrency’s valuation finds itself ensnared between the constraints of an ascending trendline and the 50-day exponential moving average (EMA), hinting at the potential for a significant price movement soon. Presently, Ethereum commands a trading price in the vicinity of $3,391.
Chart analysis reveals Ethereum’s price perched slightly above the ascending trendline, serving as a bolstering support mechanism that has forestalled further depreciation. This gradually ascending trendline suggests a correlated potential for Ethereum’s price to ascend in tandem.
Concurrently, the 50-day EMA, currently hovering around $3,400, looms just above the prevailing price. Historically, this EMA has exhibited resistance tendencies, predisposing the price to downward pressure. Ethereum finds itself sandwiched between this upper resistance and the lower support of the trendline.
A breakthrough above the 50-day EMA could propel Ethereum toward the subsequent resistance level, situated around $3,545. Conversely, failure to maintain elevation above the trendline may precipitate a descent toward the next support level, embodied by the 100-day EMA near $3,090. Should Ethereum breach this level, a further decline to the 200-day EMA at $2,665 could ensue.
Presently, market indicators present a mosaic of conflicting signals, rendering Ethereum’s price trajectory uncertain. Investors keenly observe Ethereum’s ability to sustain elevation above the trendline and surpass the barrier of the 50-day EMA, poised for potential insights into its future trajectory.